Geographic information system
Integrated computer systems for storing, analyzing, and visualizing geographic data.
A geographic information system (GIS) is a combination of computer hardware and software designed to store, manage, analyze, edit, output, and visualize geographic data. While this work often takes place within a spatial database, such a database isn't strictly required for a system to be considered a GIS. More broadly, a GIS can also include the people who use it, support staff, established procedures and workflows, the relevant academic concepts and methods, and the institutions that house it. The term "geographic information systems" (also GIS) is commonly used to refer to the industry and profession built around these systems. The academic field that studies them and their geographic principles is sometimes also called GIS, but the clearer term "GIScience" is more common; it is typically seen as a subdiscipline of geography within the branch of technical geography.
GIS is applied across many technologies, processes, and methods, and is tied to numerous operations in fields like engineering, planning, management, transport and logistics, insurance, telecommunications, and business, as well as natural sciences such as forestry, ecology, and Earth science. Because of this, GIS and location intelligence are fundamental to location-enabled services, which depend on geographic analysis and visualization. A key ability of GIS is to connect previously unrelated information by using location as the central linking variable. Locations and extents on Earth can be recorded with date and time, along with x, y, and z coordinates (representing longitude, latitude, and elevation). All Earth-based spatial and temporal references should be relatable to each other and, ultimately, to a real physical location. This characteristic has opened new avenues for scientific inquiry.
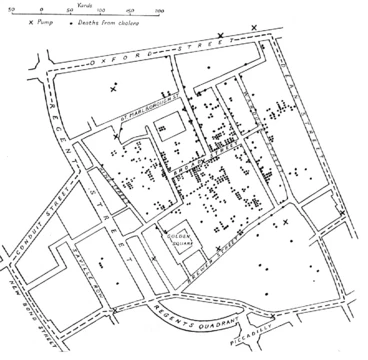
**History and development** Although digital GIS began in the mid-1960s, when Roger Tomlinson coined the term "geographic information system," many of the geographic concepts and methods it automates are decades older. One early use of spatial analysis came from epidemiology in 1832, when French cartographer Charles Picquet created a map of Paris’s forty-eight districts. Using halftone color gradients, he visually represented cholera deaths per 1,000 inhabitants. In 1854, physician John Snow used spatial analysis to find the source of a London cholera outbreak by plotting each casualty’s residence an
- field
- Geographic information systems / GIScience
- known_for
- Storing, managing, analyzing, editing, outputting, and visualizing geographic data using location as a key index variable
- first_digital_GIS_developed
- 1963 (Canada Geographic Information System, CGIS)
- term_coined_by
- Roger Tomlinson (mid-1960s)
- early_use_of_spatial_analysis
- 1832 (Charles Picquet, cholera map of Paris) and 1854 (John Snow, cholera outbreak in London)
Lore & Background
While digital GIS dates to the mid-1960s, when Roger Tomlinson first coined the phrase 'geographic information system,' many of the geographic concepts and methods that GIS automates date back decades earlier. One of the first known instances of spatial analysis came from epidemiology in 1832, when French cartographer Charles Picquet created a map of Paris using halftone color gradients to represent cholera deaths per 1,000 inhabitants. In 1854, John Snow determined the source of a London cholera outbreak by plotting casualty residences and water sources on a map, using cartographic methods that predate computer-based GIS. As for early computer cartography, Waldo Tobler published a notable paper on the subject in 1959, but it is not universally recognized as the very first. On the desktop side, the first commercial GIS product was MIDAS, released around 1985; it was renamed MapInfo in 1986, and the first Windows version finally arrived in 1991.
Reader's Guide
Geographic information systems have become foundational to location-enabled services, relying on geographic analysis and visualization. They provide the ability to relate previously unrelated information through location as the 'key index variable,' recording locations and extents in Earth's spacetime via date, time, and x, y, z coordinates (longitude, latitude, elevation). This key characteristic has opened new avenues of scientific inquiry and studies. The development of GIS moved from mainframe systems like CGIS (never commercially available) to general-purpose software from the Harvard Laboratory for Computer Graphics and Spatial Analysis (e.g., SYMAP, GRID, ODYSSEY) in the 1970s, which influenced commercial software such as Esri ARC/INFO (1983). The first desktop GIS product, MIDAS, was released in 1986 for MS-DOS, later renamed MapInfo for Windows in 1990, moving GIS from research into business. By the end of the 20th century, systems consolidated on relatively few platforms, and users began exploring GIS data over the Internet. The 21st century has seen a growing number of free, open-source GIS packages that run on various operating systems and can be customized. GIS is used in engineering, planning, management, transport/logistics, insurance, telecommunications, business, and natural sciences such as forestry, ecology, and Earth science.
Did You Know?
- The first known instance of spatial analysis was a cholera map of Paris created by Charles Picquet in 1832 using halftone color gradients.
- John Snow's 1854 cholera map was one of the earliest successful uses of geographic methodology to pinpoint the source of an outbreak.
- The Canada Geographic Information System (CGIS), developed in 1963, was the world's first true operational GIS and lasted into the 1990s.
- The first desktop GIS product, MIDAS, was released for MS-DOS in 1986 and later renamed MapInfo for Windows in 1990.
More in Spatial Analysis & Gis 1-24
Spotted an error? Know more?
This is a living reference — every entry is fact-audited, and reader corrections feed straight into our audit queue. Suggest an edit · See this site's audit record